AI Model Leaderboard
Compare AI models by category scores, value and speed from LiveBench and OpenRouter data, refreshed daily with the date shown, plus image and video rankings.
Loading the tool…
Used this tool? Share what worked for you — it helps the next person.
AI Model Leaderboard: complete guide
Walk through the steps and examples, or jump straight to the topic you need.
At a glance
- Raw data
- The server fetches the LiveBench benchmark and OpenRouter model information once a day, recalculates the rankings, and shows the as-of date at the top of the screen.
- On days it cannot be fetched
- If the raw data cannot be fetched, the tool shows the rankings built into it (as of 2026-11-12) and tells you so.
- What is shown
- The track shows the top 12 models running, and the ranking table shows up to 30th place for each measure. Measures with fewer than 3 measured models are hidden.
- Measure groups
- There are groups for overall, by field, value, speed, reliability, and image, video and music.
- Price
- US dollars per million tokens, blended at 3 input to 1 output. The Korean won conversion is a reference value converted at the European Central Bank reference rate.
How to use AI Model Leaderboard
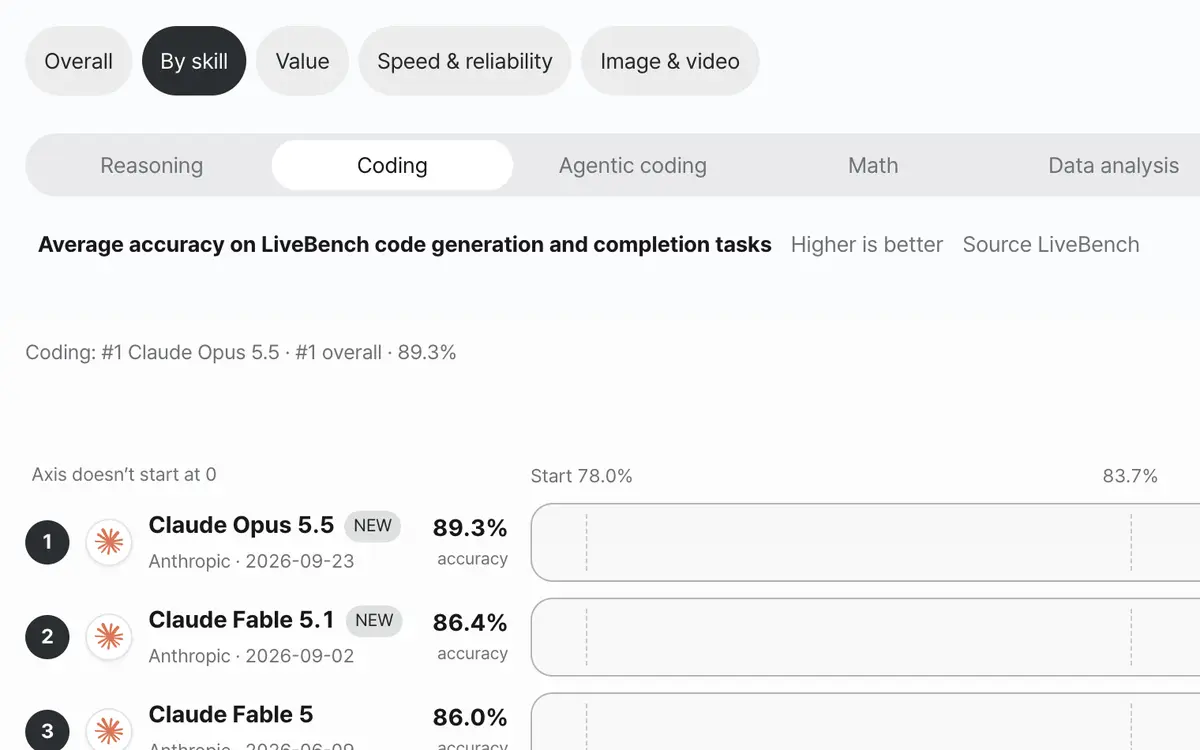
Pick a benchmark tab and the companies you want to see
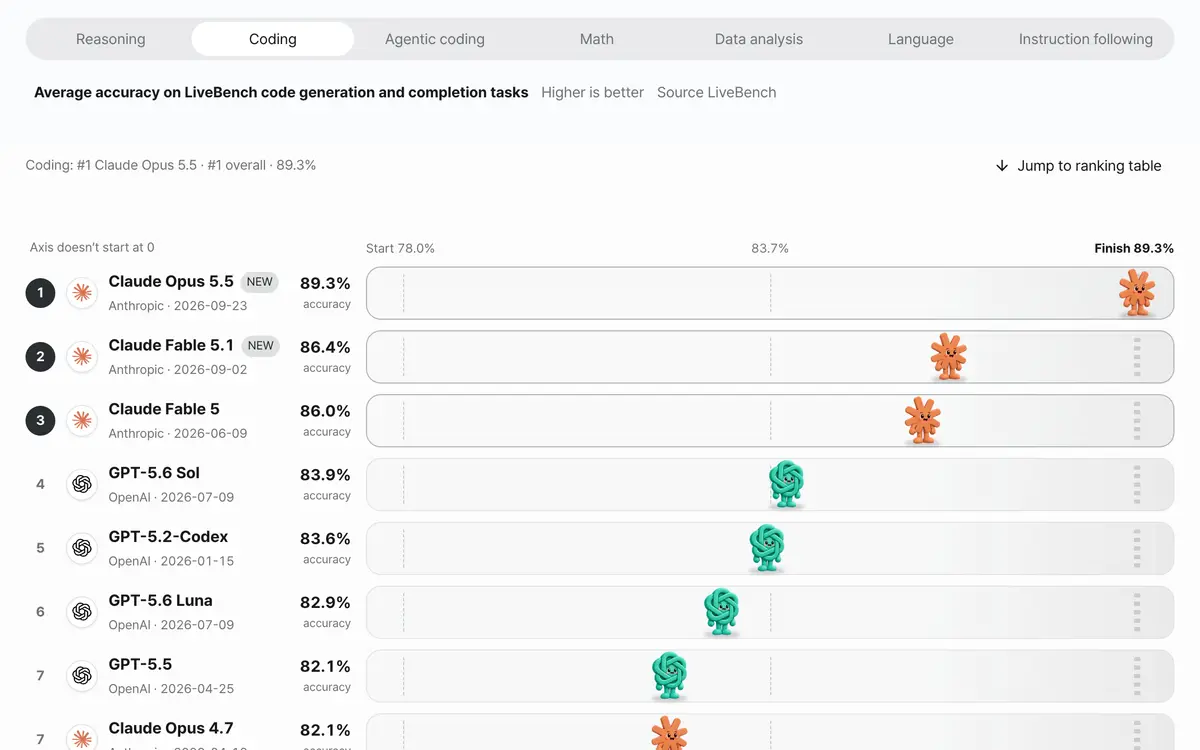
Watch the top 12 models race to their places by score
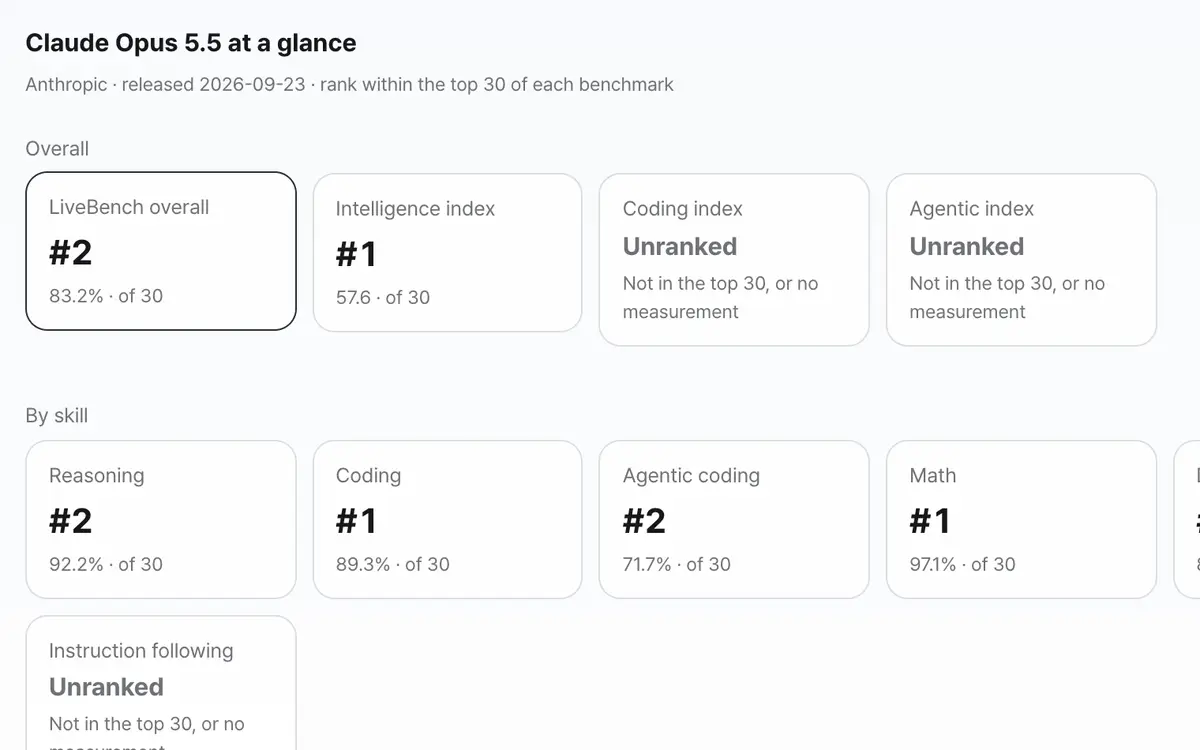
See the top 30 in the table and click a model name to gather its ranks across every benchmark
Choose what to compare
In Comparison group, choose overall, by field, value and so on, then click a measure tab inside it. Each tab states what was measured and the direction, such as higher is better.
Pick a company
Choose a company under View by company and only that company's models remain. The rank numbers keep using the overall ranking.
Read the track
The top 12 models run in proportion to their values and line up in rank order. The actual values are written on the ticks above the track, so look at the ticks, not just the distances.
Check the ranking table and model summary
In the ranking table, click Show all to expand to 30th place, and click a model name to see its rank on every measure at once.
What it’s good for
It is split into overall, by field, value and speed
Overall includes the LiveBench overall score and the intelligence, coding and agent indexes that OpenRouter provides (evaluated by Artificial Analysis). The LiveBench overall is a weighted mean of the seven LiveBench 2.0 suites (Long Agentic x2, Coding and Design x1.5, the rest x1). By field covers those seven suites: Long Agentic, Reasoning, Coding, Browser, Data Analysis, Research and Design. Value is the cost of solving one LiveBench problem and the price per million tokens, and speed and reliability are the output speed, time to first response, uptime and context length that OpenRouter measures. Being first on one measure does not mean being ahead on another, so look at the measure that fits what you want to do.
How to read the value chart
The horizontal axis is cost per success and the vertical axis is the score. The dotted blue line connects only the models for which no other model scores higher at the same cost. A model below or to the right of the line has an alternative that is cheaper and scores higher.
Read the track ticks as well
For measures where scores are close together, the track starts a little below the minimum rather than at 0 to make differences easier to see. Price and context length differ by tens of times, so they use a logarithmic scale. The actual values are written on the ticks above the track, so do not read distances directly as multiples.
Refreshed once a day
The raw data is fetched once a day, the rankings are recalculated, and the as-of date is shown at the top of the screen. Benchmarks change with the reasoning-effort setting (max, high and so on), so the value at the highest setting is shown. Price is in US dollars per million tokens, blended at 3 input to 1 output, and on the Korean-language screen a reference value in Korean won (marked with approximately) converted at that day's European Central Bank reference rate is shown beside it. Actual charges can differ by provider and discount terms.
Worked examples
Choosing the price tab
Comparison group: Value → PriceThe cheaper a model is, the closer it is to the finish line
The track uses a logarithmic scaleReading the value line
Cost per success and score
A $0.02, 60 points; B $0.05, 55 points
C $0.10, 70 points; D $0.40, 68 pointsValue line: A → CViewing just one company
View by company: choose one companyOnly that company's models remain, and rank numbers stay as the overall rankingChoosing a measure group
Swipe the table sideways to see the rest.
| Group | What it shows | Source |
|---|---|---|
| Overall | LiveBench overall (weighted mean of seven suites: Long Agentic x2, Coding and Design x1.5, the rest x1) and the intelligence, coding and agent indexes | LiveBench, OpenRouter (evaluated by Artificial Analysis) |
| By field | Long Agentic, Reasoning, Coding, Browser, Data Analysis, Research, Design (the seven LiveBench 2.0 suites) | LiveBench |
| Value | Cost per success and price per million tokens | LiveBench, OpenRouter |
| Speed and reliability | Output speed, first response, uptime, context length | OpenRouter |
When the result isn’t what you expected
It says built-in data
The raw data could not be fetched that day, so the tool is showing the rankings built into it. Check the as-of date shown and open it again later.
The model I am looking for is out of the ranking
Only the top 30 are kept for each measure. If that measure was not measured for the model or it is below 30th, the summary says it is not in the top n or has no measured data.
It says there are no models from the company I picked
That company has no model in this measure's ranking. Try a different measure or company.
Key terms
- LiveBench
- A benchmark that scores AI models on tasks across several fields. This tool uses the scores of the seven LiveBench 2.0 suites.
- Logarithmic scale
- A scale in which each tenfold increase in value moves the same distance. It is used for values that differ widely, such as price and context length.
- Value line
- A line connecting the models for which no other model scores higher at the same cost.
AI Model Leaderboard FAQ
What date are the rankings as of?
The as-of date shown at the top of the screen. The server fetches the raw LiveBench and OpenRouter data once a day, so a new model is reflected within a day at most after it appears in the raw data. On a day when the raw data cannot be fetched, the tool shows the rankings built into it, along with their as-of date.
What does being first on price mean?
It is the cheapest model when 1 million tokens are used at a 3 input to 1 output ratio. On the price tab, the cheaper a model is, the closer it is to the finish line.
Are the logos and characters official?
No. The logos and characters are used only to refer to each company's trademark, and UtilPick is not affiliated with, sponsored by or endorsed by any of these companies.
What appears when I click a model name?
A summary window opens showing the model's rank on each measure. A measure where it is not in the top 30 is shown as out of the ranking.
Sometimes the speed and first-response tabs are missing.
A measure with fewer than 3 measured models is hidden because it is hard to call it a ranking. It appears again once the raw data fills back in.


